
ADHOC Schools Verify

A controlled face-to-face reading research trial in schools, led by Dr Ross Cooper and Visual Reading coaches.
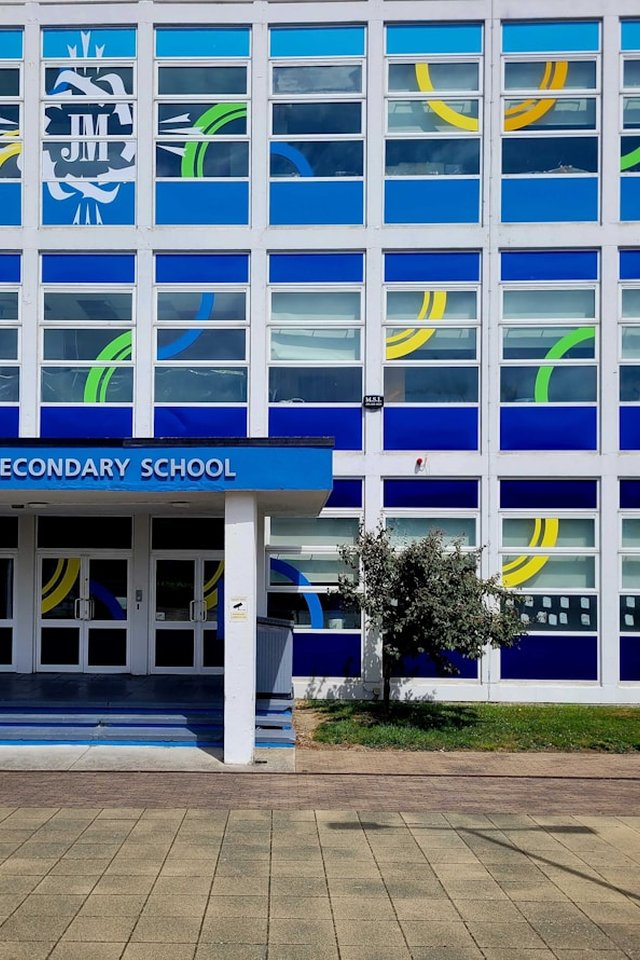

The Visual Reading Schools Project is a carefully designed research trial working with children in partner schools. Trained Visual Reading coaches deliver structured face-to-face sessions and record progress so that outcomes can be understood clearly and shared responsibly. This page explains what the project involves and shows live, anonymised summary results from the data coaches are recording. Individual children and coaches are never identified here.

Project at a glance

31

Coaches taking part

306

Children in view

153 / 153

Group A / Group B

40.9

Avg WPM gain (overall)

Figures are anonymised group summaries only. No child or coach identifiers are shown on this page.

What the project involves

Children take part in a controlled programme of reading sessions led by Visual Reading coaches. Progress is measured using words-per-minute (WPM) reading speeds and comprehension points across a series of sessions. Participants are organised into Group A and Group B for research design. On this public page we only ever refer to groups in that blinded way — we do not label which group received which condition. The charts below update from the same research records coaches enter in the secure dashboard. Only aggregated figures are shown: how many coaches and children are taking part, and how group averages change over time.

Timeline

The initial run of the Schools Project is planned from September 2026 through to the end of 2026. Findings from this first phase are expected to be prepared for publication in a professional peer-reviewed journal by summer 2027. Figures on this page may include demonstration data while live school recording is still ramping up; administrators can switch the public charts to live-only data when ready.

How we look at the results

For each child, coaches record session reading speeds (WPM) and points. Summary charts show: • Mean WPM by session for Group A and Group B • Average WPM gain from the first to the latest Phase 1 scores • Points ratio (end points ÷ start points) as a simple growth indicator You can optionally filter the public charts by group, sex/gender, ethnicity, or age band. Filters never reveal individual identities.
Schools Project community

Observed results

The figures below reflect the current research dataset (subject to the data-source setting chosen by site administrators). They are intended to help explain the scale of the project and the patterns observed so far — not to identify any child, school, or coach.

Clear filters

Avg WPM gain A / B

52.6 / 29.2

Points ratio A / B

1.864 / 1.355

End points ÷ start points (Phase 1)

Mean WPM by session (Group A vs B)

Points ratio by group

Mean WPM gain by group

If you are a school, funder, or researcher interested in the Schools Project, please get in touch via our contact page. Families and coaches taking part should continue to use their usual Visual Reading contacts and the secure dashboard for day-to-day work.
Contact us