


The Development and Impact of the online Visual Reading course with Structured Saccade Overlays (December 2022).
Since Evelyn Wood invented speed reading in the 1950’s (Frank,
1994), three key strategies are central to all advanced reading
courses:
1. The use of the finger to develop and maintain high speeds
2. Widening the reading visual span to take in multiple words at
once
3. The elimination of subvocalisation, because subvocalisation
physiologically limits reading speed to 300-350 words per minute
(wpm).
A persistent criticism of speed reading is that it improves reading speed at the expense of comprehension (Rayner, Schotter, Masson, Potter, Treiman, 2016). Consequently, a 4th strategy, to improve comprehension through metacognitive reading strategies, is now generally included. This includes techniques such as previewing, questioning texts, and reviewing. Metacognitive strategies have been known about and researched for 100 years (Thorndyke, 1923), and there was much interest in this as a study skill from the 1950s on (Russell, 1956; Smith, 1965; Sochor, 1959; Wolf, Huck, & King, 1967).
All speed reading and advanced reading skill courses are based on these four strategies. However, in practice, how the reader is enabled to read, and widen their reading visual span, varies from course to course.
Some courses merely exhort the reader to speed up and pay attention to a wider field of characters, following the rapid movement of the finger. One computer program (Lillquist, 2022) displays one or more words at a time in a fixed space on the computer screen, gradually speeding up the sequence of phrases while lengthening the phrase on display. Ron Cole’s SuperReading separates groups of words into columns (Cole, 2009); this works like the computer program, except that eye movement is required. The intention with all these strategies is to enable the reader to take in multiple words at once visually.
The Visual Reading light bulb moment
I created Visual Reading with Structured Saccade Overlays© when I
realised that a 5th strategy was needed, particularly for neurodivergent
readers. Colleagues in Italy sent me eye movement heat maps of both
dyslexic and non dyslexic readers before and after several weeks of eye
training originally intended to widen the visual span. The differences
between dyslexic and non-dyslexic readers is striking. Until this point
I had not realised quite how chaotic dyslexic eye movements (saccades)
could be compared to non- dyslexics. But what was most exciting, was to
see that the dyslexic eye movements improved dramatically in a matter of
days or weeks with eye movement practice. I consequently realised that
we needed a better strategy focused on improving control over
saccades.
The biological visual system is unique in that the left eye is not
simply connected to the right side of the brain, and the right eye to
the left side of the brain, as with the rest of the body. Rather, the
retinas are split down the middle, and each eye sends half the visual
information to the left side of the brain, and half to the right side.
This means that the brain is having to integrate four visual images when
reading. If this wasn’t complicated enough, there are two distinct
neural pathways that process different kinds of visual information
(Stein, 2001). For example, the magnocellular pathway processes visual
timing events (such as saccades) and large, fast things, whereas the
parvocellular system processes small, slow, colourful things.
Consequently, the brain is actually integrating 8 chunks of (visual)
information on the fly. In addition, if the saccade is too long, the eye
misses out some characters and the brain has to make an executive
decision about whether to fill in the missing characters (giving you the
illusion that you have seen them), or whether to go back and actually
check what they are. If the saccade is too short, the eye sees some of
the same characters twice during the two fixations. The brain must then
make an executive decision about whether the duplication of characters
means one set can be ignored, or whether the duplication makes sense. It
is also worth recognising that the brain ignores the visual information
during saccades, because it is inevitably blurry due to the movement,
and takes ‘snapshots’ when at rest, during temporary ‘fixations’ between
saccades, assembling these into a ‘real-time’ animated image of the
text. Furthermore, if the fixation lands above the line, it tends to
make the line look like it has bobbled down, and if the fixation lands
below the line, it looks like the line has bobbled up. So the brain is
doing a lot of work to make it appear as if the letters have been seen
as lined up smoothly, assembled from a series of snapshots during
fixations. The more chaotic the saccades, the more work is necessary and
the more pressure on working memory, making it increasingly difficult to
pay attention to what the words mean, or even the order in which they
have been seen. This can cause particularly difficulties for dyslexic
readers who face additional challenges with working memory and sometimes
visual perception or processing. Consequently, without gaining control
over saccades, text remains difficult to access, particularly at speed.
Structured Saccade Overlays©
As noted, some reading courses improve control over saccades
unintentionally, when the intention is to widen the visual span.
“The aim of the Eye-Hop exercises…is to help you go from reading one
word at a time to reading groups of words at a time” (Cole, 2009, p116).
Nevertheless, when this requires eye movement, it also enables some
saccade control as an unintended by-product. However, because this was
neither the intention, nor design, it does not do so as efficiently as
it might. The Visual Reading course uses overlays with calibrated
vertical grey lines. Natural saccades tend to be very short when
reading. Consequently, the Structured Saccade Overlays© start with
narrow vertical lines to match the approximate size of saccades already
being used by the reader. Gaining control over saccades does not require
extra exercises, or pre-prepared texts. It simply requires reading
whatever the reader wishes to read, while using the structured saccade
overlays as a guide with their finger/eyes, until the saccades become
accurately consistent and rhythmically regular. While gaining control,
reading slowly can be a benefit. Once the saccades become controlled,
and the reader feels confident of their finger/eye accuracy, they can
begin to speed up and widen their visual span.
The Structured Saccade Overlays© have been carefully calibrated, not
only to gain control over the saccades with minimal eye strain, but
also, to gently extend the visual span. This means that reading with the
overlays does not need to be restricted to short periods of time.
Readers can read whatever they want to read while using the overlays,
for as long as they wish, until they no longer need the overlays at all.
On average, this takes reading with the overlays for 10 minutes a day
for 5 weeks along with regular short coaching sessions, usually weekly,
to ensure readers are getting maximum benefit from the overlays. We also
help readers develop better metacognitive reading strategies as part of
ensuring that comprehension improves and that increased speed is never
at the expense of comprehension.
Perhaps the most significant improvement over SuperReading is that
readers can develop excellent reading skills while reading their own
books. Being able to choose books they have a passionate interest in, or
need to read for their studies, or work, improves engagement and
motivation and accelerates the learning process.
For all these reasons, we believe that Visual Reading is also suitable
for children. The first dyslexic 9 year old to complete the course took
a month to achieve a reading speed of 800 wpm with excellent
comprehension, the second achieved 500 wpm in a similar timeframe. We
expect to be able to add to this data in the Spring term because we now
have Visual Reading coaches utilising the Structured Saccade Overlays in
both primary and secondary schools.
The Impact of Visual Reading
From September 2021, Visual Reading replaced SuperReading on the Student Finance England portal. The impact has been dramatic. Participants learn to read with meaning, faster than 360 wpm, in less than a month (mean=29 days). The statistical model estimates that less than one in a thousand postgraduates achieve 360 wpm when reading for meaning. The mean reading speed (with good comprehension) of all those who have completed the Visual Reading course, is currently 558 wpm (p<.0000). Engagement currently stands at 94% and most students complete within two months.
Analysis of the Data Limitations
Reading speeds have been collected for all participants, and the reading
coaches have ensured that comprehension has improved. There has been no
attempt to formally measure comprehension, since this is notoriously
difficult, depending as it does on a wide range of factors, particularly
prior knowledge, tiredness, motivation, font type and size, interest,
paper colour, vocabulary, etc. It is not possible to control for all
these factors. However, readers are able to gauge their level of
comprehension (and recall) far more accurately than their reading speed,
which, like driving in a car, quickly becomes normalised. For example,
when I asked a student who had doubled their reading speed in a week if
they could guess their speed, they guessed slower than the previous
week, because they knew they had improved their comprehension. In other
words, we have learned to judge speed by our level of understanding of
the text. .Consequently, when coaching Visual Readers, while it is
important to ensure their comprehension is improving, the key metric to
feed back is reading speed.
There has been no control group, nor have the participants, at this
stage, been organised into age groups. Most of the participants are
students in higher education, but includes a few children from aged 9 to
16., and some dyslexia assessors learning to become Visual Reading
coaches. All standardised scores for reading speed are based on
standardised postgraduate reading speeds when reading for meaning.
A further limitation is the group size. To some extent, this is not much
of a limitation because high statistical significance has been achieved
by all of the smaller sub-groups. This is primarily because the impact
is extremely large and relatively consistent. But , nevertheless,
caution is advised when generalising from a relatively small sample,
particularly when .comparing sub-samples.
Overall Impact
Despite these limitations, everyone who has completed Visual Reading (and most of those that haven’t) are now reading above the ‘average range’ for postgraduates (131-248 wpm), or more specifically, within the top 7%. 84% of all participants are in the top 0.1% of postgraduates. The slowest final speed recorded is currently 273 wpm (SS 122). Participants who initially read within the average range, or better, tend to triple their reading for meaning speed (x3.04), while those who initially read below the ‘average range’ more than quadruple (x4.53) their reading for meaning speed. The mean improvement across all participants can be measured as 6.7 Standard Deviations. The lowest improvement recorded for participants who completed the course is 2.1 Standard Deviations. By any measure, this is a dramatic impact.
Outliers
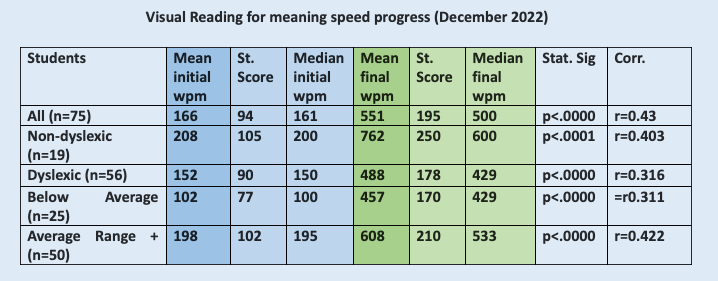
One of the issues, when working with smaller groups, is that outliers can easily distort mean scores. This is the case here, because one non-dyslexic improved their reading speed from an initial 300 wpm, to 3000 wpm (with excellent, total, visual recall). For this reason, I have also included median scores which can provide a more realistic comparison. We can see in the chart, that initial mean and median scores are very similar, but these diverge in the final scores. In every case, the median is lower than the mean to varying degrees, which is explained by having a few very high scores in each group distorting the mean up. Particularly in the non-dyslexic subgroup and those in the average range or above at the beginning, and less so in the dyslexic sub-group and those who started in the below average range. Although there is a lot of crossover between both pairs of groups.
Correlations
The correlation between initial reading speeds and final reading speeds is low to moderate (r=0.43). This can be interpreted as 18% of the improvement being explained by the starting speed. However, there is a difference between the dyslexic and non-dyslexic correlations. 16% of non-dyslexic reading speed improvement may be explained by initial speed, whereas, just 10% of the improvement for dyslexics may be. Dividing the sample differently, we can see that those starting within the ‘average range’, or above, have a stronger correlation than those who start below the ‘average range’. This can be interpreted as 18% of the ‘average’ students improvement being explained by starting speed, compared to just 10% of the improvement achieved by those who started below the ‘average range’. This suggests that the weaker the initial reading speed, the greater the relative impact. This is supporting by seeing that those who start below the ‘average range’ increase their reading speed by a factor of 4.53, whereas those who start in the average range (and above), increase by a factor of 3.02. However, another possible interpretation is that those who appeared to start below the ‘average range’ have been subject to underestimated reading speeds at the beginning. Larger sample sizes will throw additional light on these comparisons, particularly as correlation coefficients are subject to considerable change as sample sizes change.
Neurodivergent Saccades
Empirically, neurodivergent readers can be seen to make more chaotic
saccades when reading. The question remains why? We can see that all
readers appear to have poor control over their saccades when reading,
otherwise non-dyslexic readers would not also treble their reading speed
when reading for meaning through Visual Reading strategies. Explaining
why neurodivergent readers have more apparent difficulty requires
understanding the underlying nature of neurodivergence. I would argue
that the most likely explanation can be found in how we make meaning
from our experiences. We know that neurodivergent people tend to make
sense of the world holistically: how the big picture fits together. We
usually do this by thinking visually in 3 dimension and are seven times
more likely to only think visually when problem solving (that is without
words at all) than others (Cooper, 2009). Physiologically, this process
involves rapidly scanning visual imagery, whether real or imaginary, in
a random pattern, until the connections between visual objects,
patterns, or symbols are recognised. In other words,
we make meaning by utilising random saccades. In
contrast, those who solve problems and make meaning sequentially, mainly
using language, do not utilise random saccades. If it involves imagery
or seeing objects at all, the saccades are more controlled and
sequenced, limiting the vision to one step at a time. The two
experiences are markedly different.
It would seem natural to suppose, therefore, that neurodivergent
thinkers are likely to approach reading in the same manner. This is
reminiscent of Ron Davis’ disorientation (Davis, 1997), because random
saccades over a page provide little access to the text. In contrast,
verbal and sequential thinkers are more likely to approach reading in a
more sequential way. However, although the differences in control over
saccades may be slight. The consequences to reading success and trauma
can be extreme. Nevertheless, the impact of learning better control over
saccades makes much more difference to both sets of readers than the
initial difference in difficulties may indicate. The resulting outcomes
of Visual Reading propel the reader into a tiny minority of excellent
readers, whether dyslexic or not.
Conclusions
Everyone who completed the Visual Reading course in the past year has
dramatically improved their reading speed, while improving comprehension
and recall of what they have read. The intervention is usually completed
within 5 weeks and requires just 10 minutes a day along with weekly
short coaching sessions. The statistical model estimates that if someone
achieves the mean score of 558 wpm, it would place them in the top
0.0000000001% of postgraduate readers. Despite varying ages and starting
points, the impact has been consistently dramatic with high statistical
significance. Based on the standardised reading speeds of postgraduates,
the mean improvement can be measured as 6.7 Standard Deviations. Having
such a large impact may be unprecedented.
Unsurprisingly, the feedback from students has been consistently
enthusiastic:
https://outsidersoftware.co.uk/superreading-online-course/
If readers would like more information about Visual Reading with
Structured Saccade Overlays© , or wish to become involved, more
information can be found at the above link, or contact me directly:
ross@visualreadingonline.com
References:
Cole, R (2009) How to be a Super Reader, Piatkus
Cooper, R (2012) Updating the evidence of the impact of SuperReading on
dyslexic students, Journal of Inclusive practice in Further and Higher
Education; vol 4; Issue 1; p26-41, http://www.nadp-uk.org/journal/
Cooper, R (2009), Dyslexia, in (Ed. Pollak, Neurodiversity in Higher
Education), Wiley-Blackwell
Davis, R (1995), The Gift of Dyslexia, Souvenir Press
Frank S., (1994) The Evelyn Wood Seven-Day Speed Reading and Learning
Program: Remember Everything You Read, Double Your Reading Speed,
Improve Your Comprehension and ... Your Concentration, Meet Deadlines
With Ease, Fall River Press
Lillquist, K., https://www.readmei.com/ (accessed 4 April 2022)
Rayner, K, Schotter, E, Masson, M, Potter, M, Treiman,R, (2016) So Much
to Read, So Little Time: How Do We Read, and Can Speed Reading
Help?https://doi.org/10.1177/1529100615623267
Rayner, K., Slattery, T., Belanger, N., (2011), Eye movements, the
perceptual span, and reading speed, Psychon Bull Rev. 2010 Dec; 17(6):
834–839.doi: 10.3758/PBR.17.6.834
Russell, D.(1956), Children's thinking. Boston: Ginn.
Sochor, E.(1959) The nature of critical reading. Elementary English, 36,
47-55.
Stein, J (2001) The magnocellular theory of developmental dyslexia
https://doi.org/10.1002/dys.186
Thorndike, E. L. (1917) Reading as reasoning: A study of mistakes in
paragraph reading. Journal of Educational Psychology, 1917, 8,
323-332
Wolf, W., Huck, C., & King, M.(1967), Critical reading ability of
elementary school children. Columbus, Ohio: Ohio State University
Research Foundation, 1967